Introduction
In markets where investor categories are visible, price alone is only part of the picture. Foreign buying, institutional buying, and retail participation can create very different conditions even when the stock ends up at the same closing price.
That does not mean flow data should override the chart. It means the chart becomes easier to interpret when you understand who may be behind the move.
One-line summary for beginners
Flow numbers matter more when price and turnover actually respond with them instead of moving in the opposite direction.
Why this signal matters
Investor flow helps explain the quality of a move. A rally supported by foreign and institutional participation often behaves differently from a sharp move fueled mostly by fast retail chasing.
It also helps you judge persistence. One-day enthusiasm can look strong on the surface, but multi-session accumulation by larger participants often matters more for how the chart develops afterward.
When the signal becomes more meaningful
Start by comparing flow with price. If foreign or institutional buying expands while price is also moving higher, the message is usually more constructive than price strength alone.
Then look for duration. One large day matters less than several sessions of consistent inflow. That pattern often tells you the move is being supported rather than simply reacting.
Retail flow is not inherently weak or wrong, but heavy one-sided retail participation during a vertical move often raises the odds of volatility. The chart may still work, but it tends to require more caution.
Visual guide
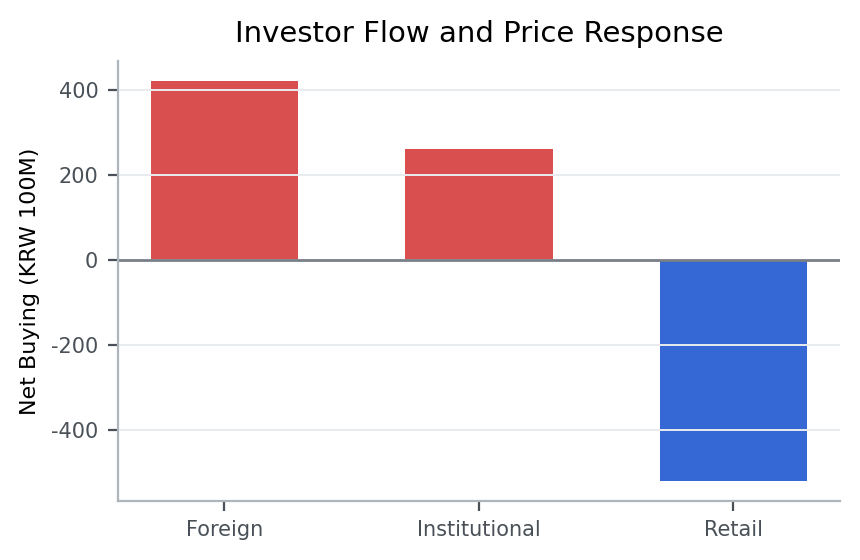
The chart compares participant flow with price reaction. What matters is not just who bought, but whether price actually responded in a stable way.
Patterns that showed up often in real data
From 2023-01-01 to 2026-03-20, the KRX, South Korea’s main stock exchange, produced the following follow-through after similar setups.
Condition: cases where turnover relative to market cap reached at least 3% and the close was still relatively firm
This article looks at what happened in the market after cases that matched sessions with heavy turnover and a relatively firm close.
5-day median return means the middle result after lining up all 5-day forward returns from cases that matched this setup between 2023-01-01 and 2026-03-20. For example, 5-day median return -2.2% for overall sample means the midpoint of those 5-day forward outcomes landed there. A negative value means the follow-through was weaker more often than not, while a positive value means the stock held up or advanced more often. 20-day median return is read the same way, except it tells you more about whether the move held up over a longer stretch. 5-day positive rate means the share of cases where the stock was actually higher five trading days later.
Across the full sample 5-day median return -2.2%, 20-day median return -5.7%, and 5-day positive rate 39.4%.
Overall, this setup did not naturally lead to stronger follow-through. Both the 5-day and 20-day median outcomes were weak, and fewer than half of the cases were higher five sessions later.
That is why flow numbers become more convincing only when price and turnover confirm the same story.
Key points from a recent example
A recent example is 폴라리스AI (039980) on 2026-03-13.
This example was chosen because it matched the article’s core condition: cases where turnover relative to market cap reached at least 3% and the close was still relatively firm. In other words, it is a recent market sample that shows how the concept looked in a real chart.
On the day itself, the stock moved 16.5%, the gap was 8.0%, the closing position was 64.0%, and turnover relative to market cap was 138.9%. On the same day, KOSDAQ, South Korea’s growth-heavy junior market, showed an advance ratio of 48.9%.
Read in the context of the 중견기업부 sector, the key is not to label the signal too quickly but to judge the close and the follow-through first. The 5-day forward return was -8.5%, and the point of the example is that flow analysis still has to be validated by price and turnover response.
That is why, when you see a similar setup again, it helps to check how strong the close was and whether the structure held over the next few sessions, not just why the stock moved that day.
Investor checklist
- Flow numbers deserve more weight only when price action confirms them.
- Watch persistence over several sessions, not a single day of buying or selling.
- If price does not respond to strong buying, ask whether other supply is still overpowering it.
Common mistakes
The first mistake is assuming foreign buying is always bullish. Flow only matters in relation to price response and structure.
The second mistake is overreacting to one day of data. Persistence usually matters more than a single reading.
The third mistake is treating retail participation as automatically weak. The real issue is whether the move looks stable or increasingly crowded.
Summary
Investor flow gives price action more depth. It helps you judge who may be supporting the move, whether the advance looks durable, and whether short-term volatility risk is rising.
For more context, read Why Sector and Theme Relative Strength Matters Before the Stock Itself and How News and Events Show Up on a Chart.