Introduction
One of the most common mistakes in chart reading is assuming that overbought means price must fall and oversold means price must bounce. In reality, both conditions are better understood as warnings about extension, not promises about direction.
Markets can stay stretched longer than people expect. That is why overbought and oversold work best as context, not as simple reversal triggers.
One-line summary for beginners
Overbought and oversold readings are closer to volatility warnings than automatic reversal signals.
Why this signal matters
This concept helps you avoid forcing a reversal too early. A strong stock can remain overbought while still climbing, and a weak stock can remain oversold while still sliding.
It also improves risk judgment. Once you recognize that a move is stretched, you stop asking whether it must reverse immediately and start asking whether the reward still justifies the risk.
When the signal becomes more meaningful
Overbought usually means price has advanced unusually fast relative to its recent behavior. Oversold means price has fallen unusually fast. The key word in both cases is unusually.
You can see these conditions through indicators like RSI, through distance from moving averages, or simply through an obviously accelerated price move. What matters is not the tool, but the idea of extension.
Once extension appears, shift the question. Do not ask whether reversal is guaranteed. Ask whether momentum is still being confirmed, whether support or resistance is nearby, and whether follow-through is improving or weakening.
Visual guide
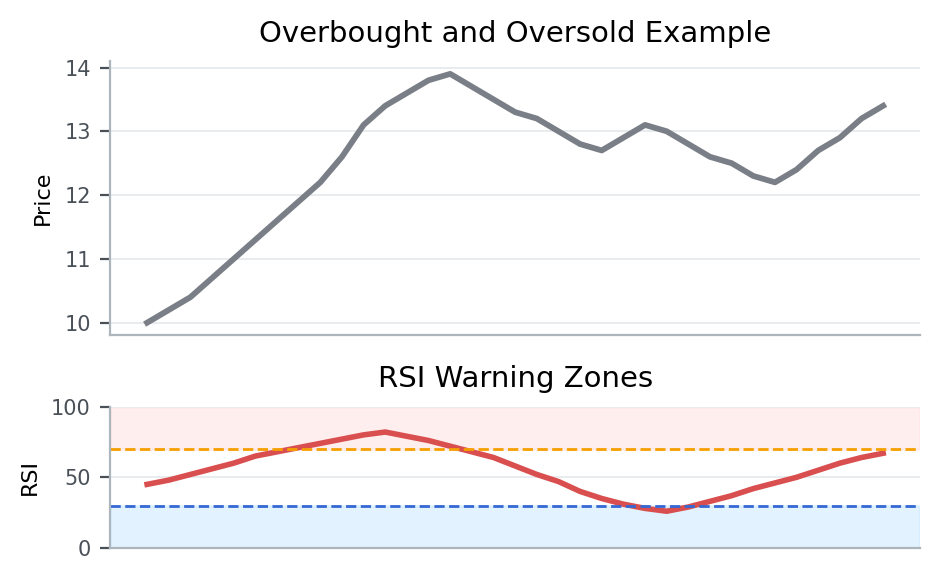
The chart highlights areas where price became unusually stretched. Those zones matter because they raise caution, not because they automatically define the next direction.
Patterns that showed up often in real data
From 2023-01-01 to 2026-03-20, the KRX, South Korea’s main stock exchange, produced the following follow-through after similar setups.
Condition: cases where RSI moved into an extreme zone
This article splits RSI readings entering an extreme zone into two versions so the contrast is easier to read.
5-day median return means the middle result after lining up all 5-day forward returns from cases that matched this setup between 2023-01-01 and 2026-03-20. For example, 5-day median return 0.0% for overbought warning zone means the midpoint of those 5-day forward outcomes landed there. A negative value means the follow-through was weaker more often than not, while a positive value means the stock held up or advanced more often. 5-day positive rate means the share of cases where the stock was actually higher five trading days later.
For overbought warning zone 5-day median return 0.0%, and 5-day positive rate 29.3%.
For oversold warning zone 5-day median return 0.0%, and 5-day positive rate 48.4%.
Overall, the pattern was mixed rather than decisive, and slightly more cases failed to finish higher after five trading days.
For overbought warning zone 5-day median return 0.0%, and 5-day positive rate 29.3%. For oversold warning zone 5-day median return 0.0%, and 5-day positive rate 48.4%. Because the metrics do not all point the same way, this condition should be read together with the rest of the chart context.
That is why extreme readings should first change your expectations for volatility, not force a reversal call.
Key points from a recent example
A recent example is 에이비프로바이오 (195990) on 2026-03-13.
This example was chosen because it matched the article’s core condition: cases where RSI moved into an extreme zone. In other words, it is a recent market sample that shows how the concept looked in a real chart.
On the day itself, the stock moved 30.0%, the gap was -1.8%, the closing position was 100.0%, and turnover relative to market cap was 11.5%. On the same day, KOSDAQ, South Korea’s growth-heavy junior market, showed an advance ratio of 48.9%.
Read in the context of the 투자주의환기종목(소속부없음) sector, the key is not to label the signal too quickly but to judge the close and the follow-through first. The 5-day forward return was 41.3%, and the point of the example is that an extreme reading should not be converted into a reversal call before the close and follow-through confirm it.
That is why, when you see a similar setup again, it helps to check how strong the close was and whether the structure held over the next few sessions, not just why the stock moved that day.
Investor checklist
- In extreme zones, think about wider volatility first rather than immediate reversal.
- Separate strong-trend overheating from exhaustion right before failure.
- Use the close and follow-through with the reading, not the indicator number alone.
Common mistakes
The first mistake is using overbought as a synonym for bearish. Strong trends often spend time overbought.
The second mistake is assuming oversold means cheap. A stock can stay weak for good structural reasons.
The third mistake is relying on the indicator without checking price location, trend, and follow-through.
Summary
Overbought and oversold conditions are best treated as warnings about speed and extension. They do not tell you exactly what comes next, but they do tell you when the chart may require more caution and better context.
For related concepts, read When RSI, MACD, and Bollinger Bands Help and When They Do Not and What Moving Averages Actually Tell You on a Chart.