Introduction
Price tells you what happened. Volume helps explain how much participation was behind it. That is why traders keep coming back to volume even when they do not use many other tools. A move with broad participation often behaves differently from a move that drifted higher on light trading.
Volume does not predict every move, but it helps you judge conviction. A breakout on strong volume usually means more traders cared. A rebound on thin volume often means the move still needs proof.
One-line summary for beginners
Volume matters less because it was large and more because the stock could still hold price after that activity showed up.
Why this signal matters
Volume gives depth to price action. Two stocks can both close up 5 percent, but the one that traded far above normal volume is telling a much stronger story about interest, urgency, or positioning.
It also helps you separate meaningful moves from fragile ones. A stock can jump sharply without much volume, but if buyers are not showing up in size, that strength may not travel very far.
When the signal becomes more meaningful
Start by comparing volume to its recent average. You do not need a perfect formula. You just want to know whether the market is paying more attention than usual.
Then compare volume to price direction. Rising price on rising volume often supports the move. Rising price on weak volume can still continue, but it deserves less confidence. Heavy volume on a weak close may tell you that supply was stronger than the headline move suggests.
Volume also matters around decision points. Support tests, resistance breaks, and pullbacks after breakouts all become easier to judge when you can see whether participation expanded or faded.
Visual guide
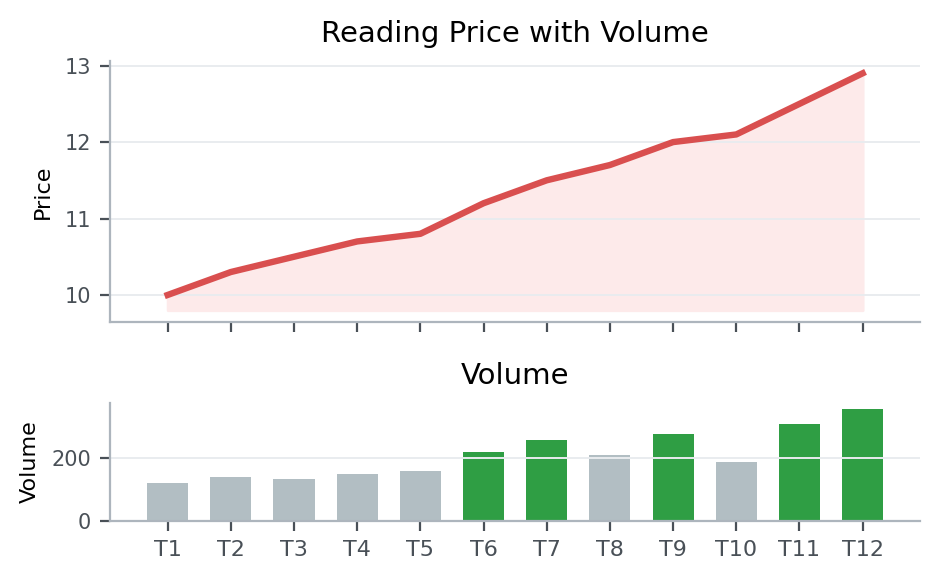
The chart compares price movement with the volume bars below it. The goal is to notice when participation confirms price and when price moves without much support.
Patterns that showed up often in real data
From 2023-01-01 to 2026-03-20, the KRX, South Korea’s main stock exchange, produced the following follow-through after similar setups.
Condition: cases where volume was at least 2x the 20-day average and turnover relative to market cap also expanded
This article looks at what happened in the market after cases that matched cases where both volume and turnover relative to market cap expanded together.
5-day median return means the middle result after lining up all 5-day forward returns from cases that matched this setup between 2023-01-01 and 2026-03-20. For example, 5-day median return -1.3% for overall sample means the midpoint of those 5-day forward outcomes landed there. A negative value means the follow-through was weaker more often than not, while a positive value means the stock held up or advanced more often. 5-day positive rate means the share of cases where the stock was actually higher five trading days later.
Across the full sample 5-day median return -1.3%, and 5-day positive rate 41.9%.
Overall, this setup did not naturally lead to stronger follow-through. Both the 5-day and 20-day median outcomes were weak, and fewer than half of the cases were higher five sessions later.
For close held near the session high 5-day median return -1.4%, and 5-day positive rate 42.3%. For intraday strength faded into a weaker close 5-day median return -1.2%, and 5-day positive rate 41.8%. If the gap stays small, this condition alone is not enough to separate stronger from weaker outcomes.
That is why volume should not stop at “it was large.” The more useful question is whether that activity helped the stock hold its gains.
Key points from a recent example
A recent example is 폴라리스AI파마 (041910) on 2026-03-13.
This example was chosen because it matched the article’s core condition: cases where volume was at least 2x the 20-day average and turnover relative to market cap also expanded. In other words, it is a recent market sample that shows how the concept looked in a real chart.
On the day itself, the stock moved 30.0%, the gap was -1.6%, the closing position was 100.0%, and turnover relative to market cap was 78.4%. On the same day, KOSDAQ, South Korea’s growth-heavy junior market, showed an advance ratio of 48.9%.
Read in the context of the 중견기업부 sector, the key is not to label the signal too quickly but to judge the close and the follow-through first. The 5-day forward return was -5.4%, and the point of the example is not that activity spiked, but that you still have to ask whether price could hold up with that turnover.
That is why, when you see a similar setup again, it helps to check how strong the close was and whether the structure held over the next few sessions, not just why the stock moved that day.
Investor checklist
- Start with volume relative to the 20-day average instead of the raw volume number.
- Check turnover relative to market cap so small-cap distortions do not fool you.
- If activity expanded, confirm that the stock still closed near the high or defended the move afterward.
Common mistakes
The first mistake is assuming high volume is always bullish. Volume measures activity, not direction.
The second mistake is ignoring what price did with that activity. Heavy volume with a poor close often tells a different story than heavy volume with a strong close.
The third mistake is judging volume without context. What matters is whether volume is high or low relative to that stock’s recent norm.
Summary
Volume is one of the cleanest ways to judge how much conviction sits behind a move. It does not replace price, but it often tells you whether price is being confirmed, challenged, or ignored.
If you want to go deeper, read Trend and Volume Together Change the Quality of a Signal and Breakouts and Pullbacks Need to Be Read Differently.