Introduction
Support and resistance matter because markets have memory. Traders remember where price previously stalled, reversed, or broke out. Those areas often attract attention again, which is why they keep appearing across so many different charts.
This does not mean the levels are exact lines. They are better understood as zones where supply or demand may become more visible. What matters is not whether price touches the level perfectly, but how price behaves when it gets there.
One-line summary for beginners
Support and resistance work better as reaction zones than as single exact lines on a chart.
Why this signal matters
Support and resistance help you organize a chart. They give you clear reference points for judging whether a move is strengthening, failing, or simply bouncing inside a range.
They also make analysis more disciplined. Instead of saying a stock looks strong because it is green, you can ask whether it cleared prior resistance. Instead of calling every dip a breakdown, you can ask whether support actually failed on a closing basis.
When the signal becomes more meaningful
Support is an area where price has previously found demand and stopped falling. Resistance is an area where price has previously met enough supply to stop advancing. These zones often come from prior swing highs, swing lows, breakout levels, and repeated range boundaries.
What matters most is reaction. A stock testing support and bouncing quickly sends a different message from a stock that slips through support and cannot get back above it. The same is true on the upside. A resistance break only becomes meaningful if price can stay above it.
The more times a level has mattered in the past, the more attention it usually gets. But repeated tests can either strengthen a level or weaken it, depending on whether price keeps rejecting there or starts absorbing the supply.
Visual guide
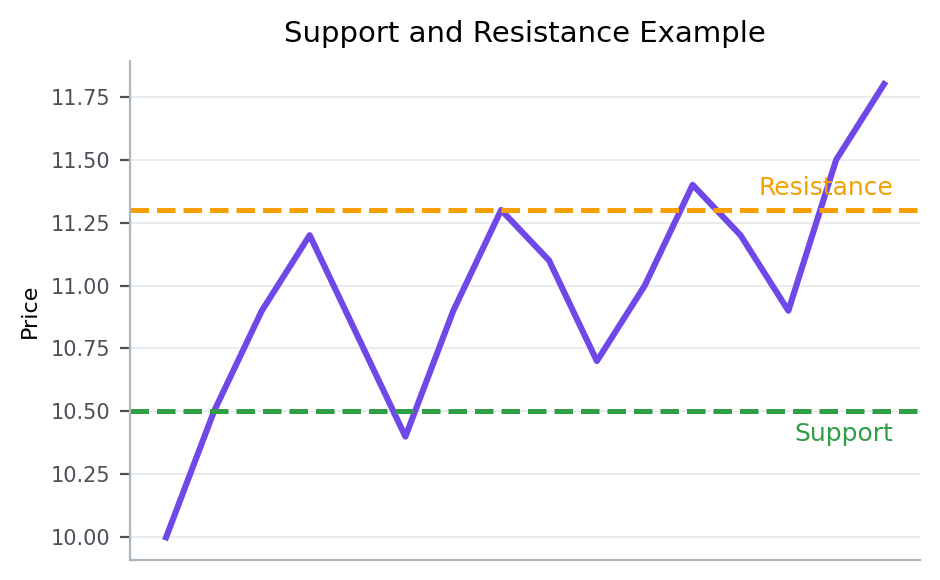
This example highlights how price often reacts around previous highs and lows. The most useful question is not whether price touched the level, but whether it held, failed, or reversed there.
Patterns that showed up often in real data
From 2023-01-01 to 2026-03-20, the KRX, South Korea’s main stock exchange, produced the following follow-through after similar setups.
Condition: cases where a 20-day high breakout was confirmed on a closing basis
This table isolates cases that matched breakouts above the prior 20-day high on a closing basis.
| Group | 5-day median return | 20-day median return | 5-day positive rate |
|---|---|---|---|
| Overall | 0.0% | 0.0% | 18.9% |
| breakout with strong close acceptance | -0.7% | -2.2% | 45.0% |
| intraday breakout but weak close acceptance | 0.0% | 0.0% | 11.3% |
5-day median return means the middle result after lining up all 5-day forward returns from cases that matched this setup between 2023-01-01 and 2026-03-20. For example, 5-day median return -0.7% for breakout with strong close acceptance means the midpoint of those 5-day forward outcomes landed there. A negative value means the follow-through was weaker more often than not, while a positive value means the stock held up or advanced more often. 20-day median return is read the same way, except it tells you more about whether the move held up over a longer stretch. 5-day positive rate means the share of cases where the stock was actually higher five trading days later.
Overall, the pattern was mixed rather than decisive, and slightly more cases failed to finish higher after five trading days.
The point of the table is not to say the pattern is always good or always bad. It is to show which extra condition changed the follow-through inside the same broad setup.
For breakout with strong close acceptance 5-day median return -0.7%, 20-day median return -2.2%, and 5-day positive rate 45.0%. For intraday breakout but weak close acceptance 5-day median return 0.0%, 20-day median return 0.0%, and 5-day positive rate 11.3%. Because the metrics do not all point the same way, this condition should be read together with the rest of the chart context.
That is why the first question after a breakout is not whether price touched the level, but whether it could stay accepted above it into the close.
Key points from a recent example
A recent example is 폴라리스AI (039980) on 2026-03-13.
This example was chosen because it matched the article’s core condition: cases where a 20-day high breakout was confirmed on a closing basis. In other words, it is a recent market sample that shows how the concept looked in a real chart.
On the day itself, the stock moved 16.5%, the gap was 8.0%, the closing position was 64.0%, and turnover relative to market cap was 138.9%. On the same day, KOSDAQ, South Korea’s growth-heavy junior market, showed an advance ratio of 48.9%.
Read in the context of the 중견기업부 sector, the key is not to label the signal too quickly but to judge the close and the follow-through first. The 5-day forward return was -8.5%, and the point of the example is that an intraday breakout should not excite you more than the stock’s ability to stay accepted above the level.
That is why, when you see a similar setup again, it helps to check how strong the close was and whether the structure held over the next few sessions, not just why the stock moved that day.
Investor checklist
- Prioritize the closing position above resistance over an intraday breakout.
- Be more cautious when the breakout clears the level without meaningful turnover.
- After the breakout, check whether the old resistance area actually starts acting like support.
Common mistakes
The first mistake is treating levels as exact numbers. Real charts usually respond inside zones, not at perfect prices.
The second mistake is calling every intraday move a break. Closing behavior and follow-through matter far more than a temporary push through the level.
The third mistake is ignoring context. A support break in a weak broader structure matters more than a tiny shakeout inside a strong trend.
Summary
Support and resistance are where price memory becomes visible. They help you judge whether buyers are still defending key areas, whether sellers are still active overhead, and whether a move has actually changed character.
To extend this idea, read Breakouts and Pullbacks Need to Be Read Differently and How to Read Failed Patterns and False Breakouts.