Introduction
Candlesticks are one of the first things people notice on a stock chart. A candle looks simple, but it carries more information than whether price closed up or down. In a single bar, you can see where buyers gained control, where sellers pushed back, and whether momentum held into the close.
Reading candles well is less about memorizing pattern names and more about reading context. A long bullish candle after a long base does not mean the same thing as a long bullish candle after a three-week chase higher. The shape matters, but the location matters more.
One-line summary for beginners
A candle becomes more useful when you read the closing position and the intraday range together instead of naming the shape alone.
Why this signal matters
Candles help turn price action into something readable. A wide real body often points to decisive buying or selling pressure, while a long upper wick can show that strength faded before the close. Even when you are not using a complex setup, candles help describe the quality of a move.
Candles also become more useful when they are read with support, resistance, volume, and news flow. The same upper wick can mean routine profit-taking in one situation and outright rejection in another. Context is what turns a candle from a visual pattern into usable information.
When the signal becomes more meaningful
The real body is the distance between the open and the close. If the close is above the open, the candle is bullish. If the close is below the open, it is bearish. A large body usually means one side controlled most of the session, while a small body often means the session was more balanced.
The upper wick shows how far price traded above the close before being pushed back down. The lower wick shows how far price fell below the close before recovering. Long wicks often tell you where pressure appeared during the day, but they need follow-through to matter.
Single candles should be read as clues, not verdicts. A long bullish candle near the top of an extended move may be exhaustion. The same candle after a quiet range may be the beginning of a breakout. What happened before the candle is part of the signal.
Visual guide
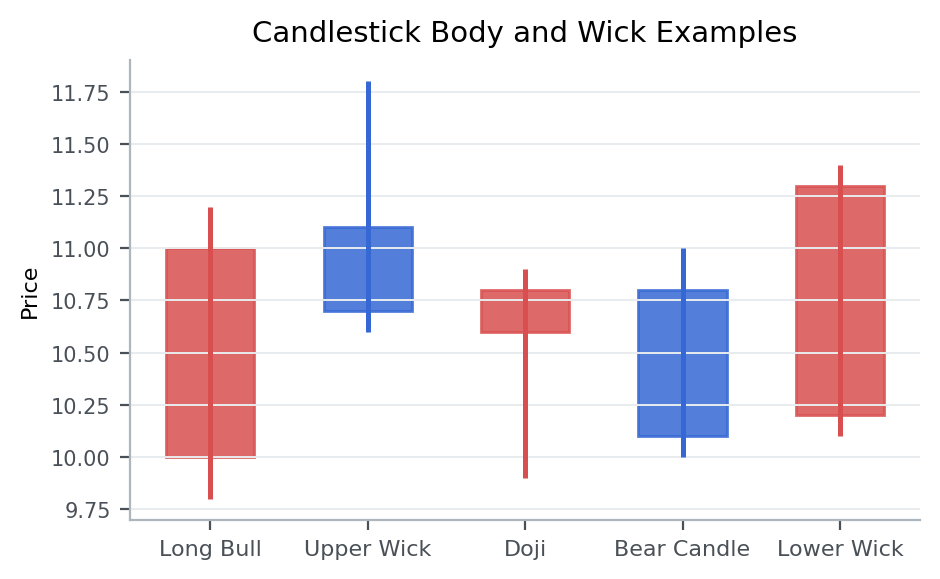
This image shows several common candle shapes in simplified form. The point is not to memorize the drawings, but to recognize how the same shape can mean something different depending on trend, location, and follow-through.
Patterns that showed up often in real data
From 2023-01-01 to 2026-03-20, the KRX, South Korea’s main stock exchange, produced the following follow-through after similar setups.
Condition: cases where the intraday range was at least 7% and the closing position finished at an extreme
This article looks at what happened in the market after cases that matched cases with a wide intraday range and an extreme closing position.
5-day median return means the middle result after lining up all 5-day forward returns from cases that matched this setup between 2023-01-01 and 2026-03-20. For example, 5-day median return -1.0% for overall sample means the midpoint of those 5-day forward outcomes landed there. A negative value means the follow-through was weaker more often than not, while a positive value means the stock held up or advanced more often. 5-day positive rate means the share of cases where the stock was actually higher five trading days later.
Across the full sample 5-day median return -1.0%, and 5-day positive rate 45.1%.
Overall, this setup did not naturally lead to stronger follow-through. Both the 5-day and 20-day median outcomes were weak, and fewer than half of the cases were higher five sessions later.
For bullish-style candle close 5-day median return -1.2%, and 5-day positive rate 44.4%. For bearish-style candle close 5-day median return -0.8%, and 5-day positive rate 45.7%. In other words, bearish-style candle close produced the better follow-through across the metrics shown here.
That is why reading where the close finished inside the range is often more practical than memorizing candle names.
Key points from a recent example
A recent example is 한국ANKOR유전 (152550) on 2026-03-13.
This example was chosen because it matched the article’s core condition: cases where the intraday range was at least 7% and the closing position finished at an extreme. In other words, it is a recent market sample that shows how the concept looked in a real chart.
On the day itself, the stock moved -5.2%, the gap was 9.1%, the closing position was 3.2%, and turnover relative to market cap was 81.7%. On the same day, KOSPI, South Korea’s large-cap benchmark index, showed an advance ratio of 35.6%.
Read in the context of the - sector, the key is not to label the signal too quickly but to judge the close and the follow-through first. The 5-day forward return was -27.9%, and the point of the example is that reading the closing position and intraday shake matters more than assigning a candle label.
That is why, when you see a similar setup again, it helps to check how strong the close was and whether the structure held over the next few sessions, not just why the stock moved that day.
Investor checklist
- Read the closing position inside the day’s range before naming the candle.
- When a long wick appears, watch the next session for acceptance or rejection.
- Treat the same large candle differently when the gap and turnover backdrop are different.
Common mistakes
The first mistake is treating candle names as fixed predictions. A hammer, doji, or engulfing candle can be useful shorthand, but no candle works the same way in every location on every chart.
The second mistake is reading one candle in isolation. Candles are part of a sequence. The next one or two sessions often matter more than the original shape itself.
The third mistake is ignoring volume. A dramatic candle without volume can be fragile, while an ordinary-looking candle with real participation can be far more important.
Summary
Candlesticks are the basic visual language of price action. The body shows control, the wicks show rejection and recovery, and the closing location often tells you how much of the intraday move actually held.
If you want to build on this foundation, read Why Support and Resistance Keep Showing Up and How to Read Failed Patterns and False Breakouts next.