Introduction
Stocks do not move on headlines alone. They move on how the market reacts to those headlines. Earnings, contracts, policy changes, regulatory updates, and broker notes can all matter, but the chart tells you whether the market treated the event as meaningful, crowded, or disappointing.
That is why event-driven chart reading is not really about reading news first. It is about watching how price and volume absorb the news once it hits the market.
One-line summary for beginners
When news hits, the real signal is not the headline but the mix of gap, turnover, and closing strength that follows.
Why this signal matters
This approach helps you avoid a common trap: assuming a “good” headline must create a strong chart. Markets often price in expectations early. Sometimes the headline is positive but the stock cannot hold the move because too much optimism was already in the price.
It also helps you read negative events more accurately. A bad headline that fails to break the chart can sometimes tell you more than the headline itself.
When the signal becomes more meaningful
Start with location. Was the event released after a long base, near a major resistance area, or after a sharp run? The same news will mean different things in different spots on the chart.
Then watch volume and the closing position. Strong events often bring heavy participation and a close near the highs. Weak reactions often produce early excitement and poor closing strength.
Finally, check follow-through. Some events matter only for a day. Others keep influencing the stock for several sessions because the market keeps acting on them.
Visual guide
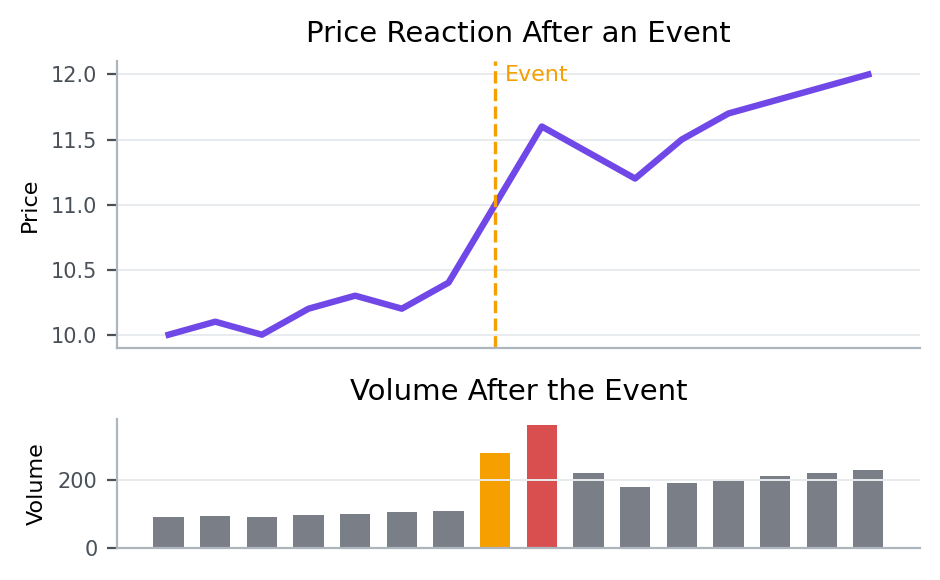
The vertical marker shows the event timing. What matters most is not the headline itself, but whether price held the reaction and whether volume confirmed it.
Patterns that showed up often in real data
From 2023-01-01 to 2026-03-20, the KRX, South Korea’s main stock exchange, produced the following follow-through after similar setups.
Condition: event-style cases where the stock opened with a gap of at least 5% and turnover was also high
This article splits event-style reactions with a gap of at least 5% and high turnover into two versions so the contrast is easier to read.
5-day median return means the middle result after lining up all 5-day forward returns from cases that matched this setup between 2023-01-01 and 2026-03-20. For example, 5-day median return -3.8% for gap held with strong closing acceptance means the midpoint of those 5-day forward outcomes landed there. A negative value means the follow-through was weaker more often than not, while a positive value means the stock held up or advanced more often. 20-day median return is read the same way, except it tells you more about whether the move held up over a longer stretch.
For gap held with strong closing acceptance 5-day median return -3.8%, and 20-day median return -9.3%.
For gap reaction faded into a weak close 5-day median return -2.6%, and 20-day median return -6.3%.
Overall, this setup did not naturally lead to stronger follow-through. Both the 5-day and 20-day median outcomes were weak, and fewer than half of the cases were higher five sessions later.
For gap held with strong closing acceptance 5-day median return -3.8%, and 20-day median return -9.3%. For gap reaction faded into a weak close 5-day median return -2.6%, and 20-day median return -6.3%. In other words, gap reaction faded into a weak close produced the better follow-through across the metrics shown here.
That is why event reactions are better judged through the gap, the close, and the next few sessions than through the headline itself.
Key points from a recent example
A recent example is 일지테크 (019540) on 2026-03-13.
This example was chosen because it matched the article’s core condition: event-style cases where the stock opened with a gap of at least 5% and turnover was also high. In other words, it is a recent market sample that shows how the concept looked in a real chart.
On the day itself, the stock moved -0.2%, the gap was 30.0%, the closing position was 0.5%, and turnover relative to market cap was 79.1%. On the same day, KOSDAQ, South Korea’s growth-heavy junior market, showed an advance ratio of 48.9%.
Read in the context of the 우량기업부 sector, the key is not to label the signal too quickly but to judge the close and the follow-through first. The 5-day forward return was 3.9%, and the point of the example is that the gap and the next 5 trading days often tell you more than the headline itself.
That is why, when you see a similar setup again, it helps to check how strong the close was and whether the structure held over the next few sessions, not just why the stock moved that day.
Investor checklist
- Judge the close and turnover persistence before reacting to the size of the gap.
- Separate stock-only reactions from moves that are spreading across the whole sector.
- The 2-to-5 session follow-through often matters more than the first day’s headline reaction.
Common mistakes
The first mistake is assuming the quality of the news and the quality of the chart are the same thing. They often are not.
The second mistake is reacting only to the opening move. The close and the next few sessions often tell the more important story.
The third mistake is ignoring sector context. Some events matter more when related stocks and the broader theme are also responding.
Summary
Event-driven chart reading is really about reaction quality. The market decides whether a headline becomes a breakout, a fade, or a non-event, and the chart makes that judgment visible.
To expand this framework, read How to Read Foreign and Institutional Flow Differently and Why Sector and Theme Relative Strength Matters Before the Stock Itself.