Introduction
Most traders focus on the latest candle, the latest headline, or the latest percentage move. Market structure forces you to zoom out. It asks a simpler question first: is price making higher highs and higher lows, drifting sideways, or breaking down into a weaker pattern?
That shift in perspective matters because a move only has meaning inside a larger shape. A strong green day inside a weak structure can be nothing more than a bounce. A modest pullback inside a healthy structure may just be normal consolidation.
One-line summary for beginners
Market structure helps separate a real shift in trend from a move that only looks strong for a day or two.
Why this signal matters
Structure helps you separate noise from change. A stock can rally hard on a single catalyst, but if it is still trapped below a broken support zone or failing to reclaim prior swing highs, the larger picture may not have improved much.
It also helps you avoid overreacting. When you recognize whether a chart is trending, ranging, or breaking apart, you stop treating every day as a fresh story. Instead, you start reading each day as a piece of an ongoing pattern.
When the signal becomes more meaningful
Start with the relationship between highs and lows. A series of higher highs and higher lows is the simplest sign of an uptrend. Lower highs and lower lows point to a downtrend. Repeated swings inside a defined band point to a range.
Then look for transition. A weak stock often begins to improve when it stops making lower lows and starts building a higher low. A strong stock often begins to weaken when lower highs start appearing and recent support stops holding.
Ranges matter too. A sideways pattern is not empty space. It is a balance area where the market is deciding whether to continue, reverse, or fail. The breakout or breakdown from that area often matters more than the movement inside it.
Visual guide
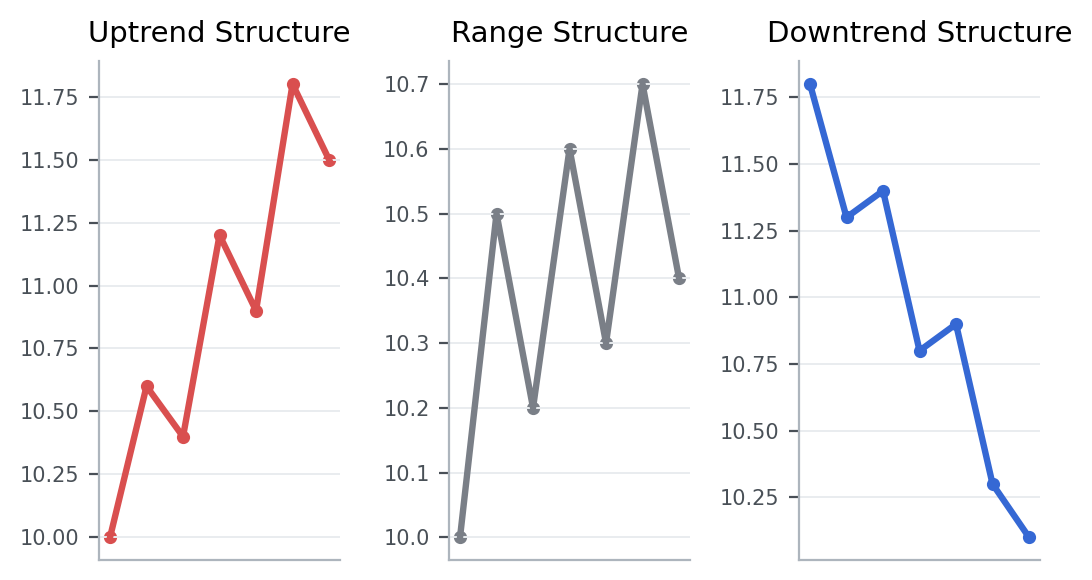
These simplified panels show three common structural states: trending higher, moving sideways, and trending lower. The goal is to identify the larger shape before reacting to any single session.
Patterns that showed up often in real data
From 2023-01-01 to 2026-03-20, the KRX, South Korea’s main stock exchange, produced the following follow-through after similar setups.
Condition: cases where the medium-term structure improved and the 60-day return was also positive
This article looks at what happened in the market after cases that matched cases where the medium-term structure improved and the close stayed relatively firm.
5-day median return means the middle result after lining up all 5-day forward returns from cases that matched this setup between 2023-01-01 and 2026-03-20. For example, 5-day median return -0.9% for overall sample means the midpoint of those 5-day forward outcomes landed there. A negative value means the follow-through was weaker more often than not, while a positive value means the stock held up or advanced more often. 5-day positive rate means the share of cases where the stock was actually higher five trading days later.
Across the full sample 5-day median return -0.9%, and 5-day positive rate 42.6%.
Overall, this setup did not naturally lead to stronger follow-through. Both the 5-day and 20-day median outcomes were weak, and fewer than half of the cases were higher five sessions later.
That is why improving structure still needs a decent close and later confirmation before it deserves a stronger conclusion.
Key points from a recent example
A recent example is 이루온 (065440) on 2026-03-13.
This example was chosen because it matched the article’s core condition: cases where the medium-term structure improved and the 60-day return was also positive. In other words, it is a recent market sample that shows how the concept looked in a real chart.
On the day itself, the stock moved 0.5%, the gap was 1.6%, the closing position was 27.6%, and turnover relative to market cap was 97.0%. On the same day, KOSDAQ, South Korea’s growth-heavy junior market, showed an advance ratio of 48.9%.
Read in the context of the 벤처기업부 sector, the key is not to label the signal too quickly but to judge the close and the follow-through first. The 5-day forward return was 0.2%, and the point of the example is that even an improving structure can fail if later lows do not hold, so one strong day is not enough.
That is why, when you see a similar setup again, it helps to check how strong the close was and whether the structure held over the next few sessions, not just why the stock moved that day.
Investor checklist
- Focus on whether structure is rebuilding, not only on whether one day looked strong.
- Inside a range, make sure the top and bottom have been respected more than once.
- Treat a higher low after the bounce as stronger proof than the bounce candle alone.
Common mistakes
The first mistake is treating daily volatility as structural change. One strong or weak session rarely rewrites the whole chart on its own.
The second mistake is assuming a range means nothing. Some of the most important moves begin with a quiet base, but only after price proves it can escape that base.
The third mistake is declaring a trend change too early. Structure usually shifts through changes in swing highs and lows, not through one dramatic candle.
Summary
Market structure gives price action a frame. It helps you understand whether a move is a continuation, a pause, or an early sign that the chart is changing character.
To take this further, read Why a Move Looks Different Across Timeframes and What Strong Stocks Tend to Look Like on a Chart.