Introduction
Not every sideways period means the same thing. Sometimes a stock is quietly being accumulated before a larger move. Other times it is being distributed into strength while the chart still looks stable on the surface. The difference matters because the next directional move often depends on it.
Accumulation and distribution are not labels you can assign from one candle. They are patterns of behavior. You are trying to understand whether a stock is absorbing supply and preparing to move, or meeting repeated selling pressure near the highs.
One-line summary for beginners
Accumulation and distribution are not claims about hidden intent; they are ways to read how turnover behaves inside a range.
Why this signal matters
This concept helps explain why two similar-looking consolidations can lead to very different outcomes. One base breaks out and keeps going. Another breaks down or produces a weak, failed breakout.
It also helps you read price action more thoughtfully. Instead of seeing every range as random noise, you start asking whether the stock is building pressure under resistance or showing repeated signs of supply overhead.
When the signal becomes more meaningful
Accumulation often appears after a decline or long base when selling pressure begins to fade, lows stop getting worse, and volume improves without price immediately collapsing. The stock may not look exciting yet, but the behavior starts to look steadier.
Distribution often appears after a strong run when price stops making clean progress even though activity stays elevated. The stock may keep testing the highs, but the closes get weaker, the wicks grow longer, and upside follow-through becomes less reliable.
Context matters. A tight range near the lows has a different meaning from a choppy range after a vertical move. Location is part of the signal.
Visual guide
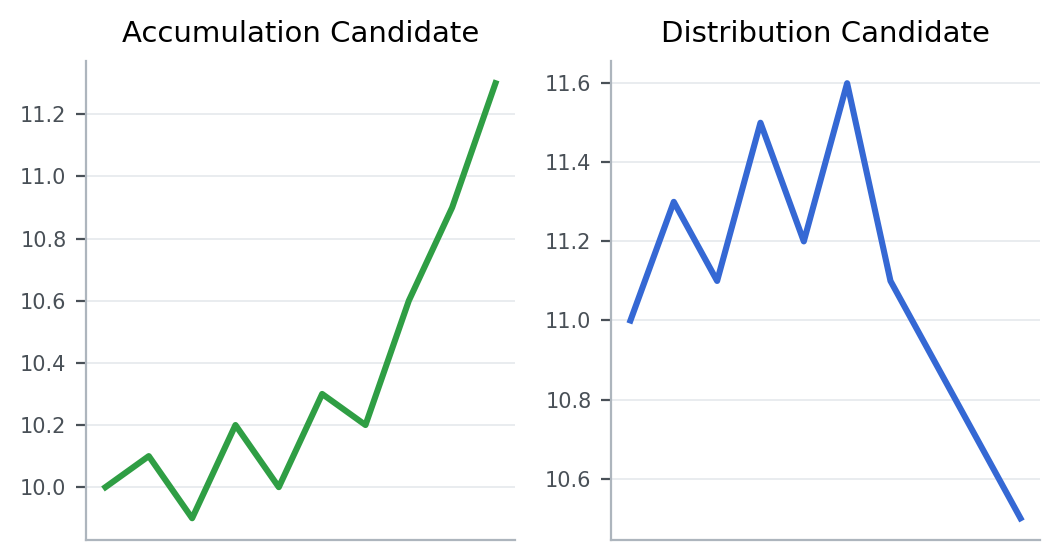
The first pattern shows improving stability and absorption near the lows. The second shows repeated pressure near the highs even though activity remains elevated.
Patterns that showed up often in real data
From 2023-01-01 to 2026-03-20, the KRX, South Korea’s main stock exchange, produced the following follow-through after similar setups.
Condition: sideways cases where price stayed inside a range while turnover relative to market cap still held up
This table isolates cases that matched sideways ranges where turnover held up without a decisive directional break.
| Group | 5-day median return | 20-day median return | 5-day positive rate |
|---|---|---|---|
| Overall | -0.8% | -2.5% | 42.8% |
| range with persistent turnover | -1.4% | -3.9% | 40.5% |
| quiet range with lighter turnover | -0.6% | -1.9% | 44.2% |
5-day median return means the middle result after lining up all 5-day forward returns from cases that matched this setup between 2023-01-01 and 2026-03-20. For example, 5-day median return -1.4% for range with persistent turnover means the midpoint of those 5-day forward outcomes landed there. A negative value means the follow-through was weaker more often than not, while a positive value means the stock held up or advanced more often. 20-day median return is read the same way, except it tells you more about whether the move held up over a longer stretch. 5-day positive rate means the share of cases where the stock was actually higher five trading days later.
Overall, this setup did not naturally lead to stronger follow-through. Both the 5-day and 20-day median outcomes were weak, and fewer than half of the cases were higher five sessions later.
The point of the table is not to say the pattern is always good or always bad. It is to show which extra condition changed the follow-through inside the same broad setup.
For range with persistent turnover 5-day median return -1.4%, 20-day median return -3.9%, and 5-day positive rate 40.5%. For quiet range with lighter turnover 5-day median return -0.6%, 20-day median return -1.9%, and 5-day positive rate 44.2%. In other words, quiet range with lighter turnover produced the better follow-through across the metrics shown here.
That is why a long range should not automatically be called accumulation. The actual break and the quality of turnover still matter.
Key points from a recent example
A recent example is 테라뷰 (950250) on 2026-03-13.
This example was chosen because it matched the article’s core condition: sideways cases where price stayed inside a range while turnover relative to market cap still held up. In other words, it is a recent market sample that shows how the concept looked in a real chart.
On the day itself, the stock moved 0.0%, the gap was 4.2%, the closing position was 47.1%, and turnover relative to market cap was 52.3%. On the same day, KOSDAQ, South Korea’s growth-heavy junior market, showed an advance ratio of 48.9%.
Read in the context of the 기술성장기업부 sector, the key is not to label the signal too quickly but to judge the close and the follow-through first. The 5-day forward return was -6.5%, and the point of the example is that range action with turnover should not be labeled too quickly before the actual direction break arrives.
That is why, when you see a similar setup again, it helps to check how strong the close was and whether the structure held over the next few sessions, not just why the stock moved that day.
Investor checklist
- When the range lasts longer, pay more attention to whether price still resists sharp rejection near the top.
- If turnover expands near the range high but the close stays weak, keep distribution risk on the table.
- Avoid declaring hidden intent too early and wait for the actual break above or below the range.
Common mistakes
The first mistake is assuming all sideways movement is accumulation. Some ranges are simply pauses, and some are distribution zones.
The second mistake is judging the pattern through volume alone. Volume matters, but location and closing behavior matter just as much.
The third mistake is deciding too early. Accumulation and distribution are easier to name after resolution than during the middle of the range.
Summary
Accumulation and distribution are really about intent inside a range. Is supply being absorbed, or is strength being sold into? The answer usually becomes clearer when you combine price location, volume behavior, and the way the stock closes near key levels.
To build on this idea, read Breakouts and Pullbacks Need to Be Read Differently and How to Read Failed Patterns and False Breakouts.