Introduction
Strong stocks usually leave clues before everyone agrees they are strong. They recover faster, pull back more cleanly, and spend less time looking broken. Those recurring behaviors are what make leadership visible on a chart.
The point is not to chase every stock that moves quickly. The point is to understand what strength actually looks like once price action becomes selective.
One-line summary for beginners
Strong stocks usually show their edge through shallow pullbacks and quick recoveries, not only through sharp rallies.
Why this signal matters
Recognizing strong-stock behavior helps you separate healthy consolidation from real weakness. It also helps you understand why some stocks keep attracting buyers while others only bounce temporarily.
A strong stock does not need to go straight up. In many cases, the biggest clue is how well it handles pressure rather than how fast it rises.
When the signal becomes more meaningful
Look for shallow pullbacks after advances. Strong stocks usually give back less ground than weaker names and often stabilize before the broader market expects them to.
Look for quick recoveries. When strong stocks test support, they tend to reclaim ground efficiently instead of spending weeks trying to repair obvious damage.
Look for relative firmness. A stock that resists market weakness, holds prior breakout zones, or returns to the highs faster than peers often deserves more respect.
Visual guide
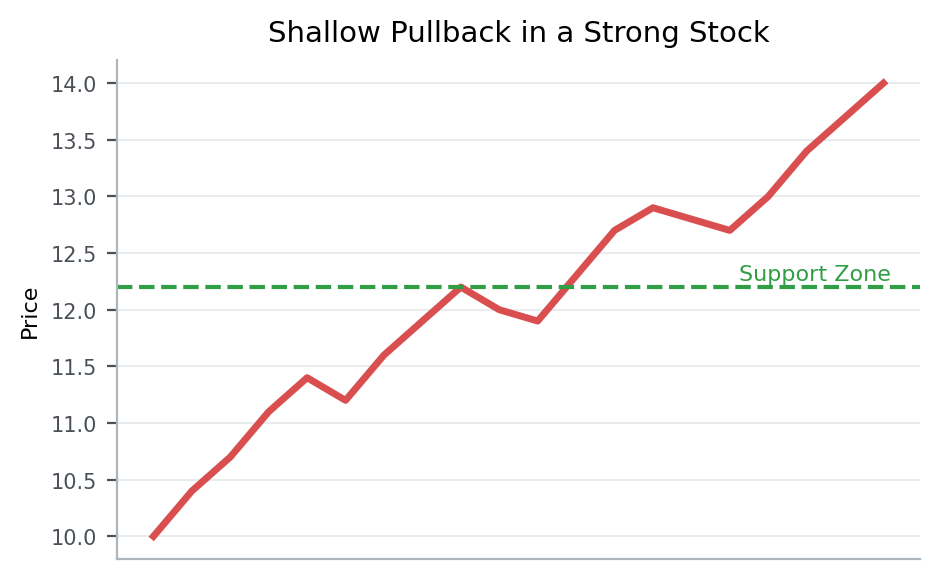
The chart shows a common strength profile: breakout, controlled pullback, and renewed advance with structure still intact.
Patterns that showed up often in real data
From 2023-01-01 to 2026-03-20, the KRX, South Korea’s main stock exchange, produced the following follow-through after similar setups.
Condition: cases where 20-day relative strength versus the market was high and the recent pullback stayed shallow
This table isolates cases that matched stocks with strong relative performance and shallow recent pullbacks.
| Group | 5-day median return | 20-day median return | 5-day positive rate |
|---|---|---|---|
| Overall | -1.4% | -4.2% | 42.1% |
| strong stock with a shallow pullback | -1.2% | -3.5% | 42.7% |
| high relative strength but a deeper pullback | -2.1% | -6.0% | 40.5% |
5-day median return means the middle result after lining up all 5-day forward returns from cases that matched this setup between 2023-01-01 and 2026-03-20. For example, 5-day median return -1.2% for strong stock with a shallow pullback means the midpoint of those 5-day forward outcomes landed there. A negative value means the follow-through was weaker more often than not, while a positive value means the stock held up or advanced more often. 20-day median return is read the same way, except it tells you more about whether the move held up over a longer stretch. 5-day positive rate means the share of cases where the stock was actually higher five trading days later.
Overall, this setup did not naturally lead to stronger follow-through. Both the 5-day and 20-day median outcomes were weak, and fewer than half of the cases were higher five sessions later.
The point of the table is not to say the pattern is always good or always bad. It is to show which extra condition changed the follow-through inside the same broad setup.
For strong stock with a shallow pullback 5-day median return -1.2%, 20-day median return -3.5%, and 5-day positive rate 42.7%. For high relative strength but a deeper pullback 5-day median return -2.1%, 20-day median return -6.0%, and 5-day positive rate 40.5%. In other words, strong stock with a shallow pullback produced the better follow-through across the metrics shown here.
That is why strong stocks are usually better identified by the quality of their pullbacks and recoveries than by one explosive up day.
Key points from a recent example
A recent example is 이루온 (065440) on 2026-03-13.
This example was chosen because it matched the article’s core condition: cases where 20-day relative strength versus the market was high and the recent pullback stayed shallow. In other words, it is a recent market sample that shows how the concept looked in a real chart.
On the day itself, the stock moved 0.5%, the gap was 1.6%, the closing position was 27.6%, and turnover relative to market cap was 97.0%. On the same day, KOSDAQ, South Korea’s growth-heavy junior market, showed an advance ratio of 48.9%.
Read in the context of the 벤처기업부 sector, the key is not to label the signal too quickly but to judge the close and the follow-through first. The 5-day forward return was 0.2%, and the point of the example is that shallow pullbacks and recovery speed usually reveal strength better than the rally percentage alone.
That is why, when you see a similar setup again, it helps to check how strong the close was and whether the structure held over the next few sessions, not just why the stock moved that day.
Investor checklist
- Strong stocks usually protect nearby support better during pullbacks.
- Check whether the stock keeps outperforming the market instead of only rising in absolute terms.
- Look for turnover to return again after a shallow pause.
Common mistakes
The first mistake is assuming every fast mover is a strong stock. Speed without structure often fades quickly.
The second mistake is dismissing all pullbacks as weakness. Strong charts often need pullbacks to prove they can hold gains.
The third mistake is ignoring relative behavior. A stock may look fine on its own but still lag badly against peers and sector leaders.
Summary
Strong stocks tend to show orderly pullbacks, quicker recoveries, and better resilience around key levels. Those are the patterns that often separate true leadership from temporary excitement.
To go further, read Breakouts and Pullbacks Need to Be Read Differently and Why Sector and Theme Relative Strength Matters Before the Stock Itself.