Introduction
Some of the most important chart messages come from moves that do not work. A breakout that fails, a reclaim that cannot hold, or a support break that immediately reverses can tell you more about supply and demand than a clean textbook pattern.
That is why failed patterns deserve serious attention. They are not just mistakes on the chart. They are evidence that one side could not sustain control.
One-line summary for beginners
A breakout can still fail quickly if price cannot hold the level on a closing basis after the first push.
Why this signal matters
Reading failed patterns helps you stay realistic. Not every breakout becomes a trend, and not every strong candle deserves trust. Failure often appears right where confidence becomes highest.
It also sharpens risk management. Once you understand how false moves behave, you stop treating every push through a level as meaningful proof.
When the signal becomes more meaningful
A false breakout usually starts with a push above an obvious resistance level that does not hold. Price may trade above the level briefly, but the close weakens or the stock falls back into the old range soon afterward.
A failed breakdown works the same way in reverse. Price dips below support, looks weak for a moment, and then recovers quickly. That kind of trap often catches traders who reacted too early to the break.
The most important clues are acceptance, closing behavior, and follow-through. The failure is not the touch through the level. The failure is the inability to stay there.
Visual guide
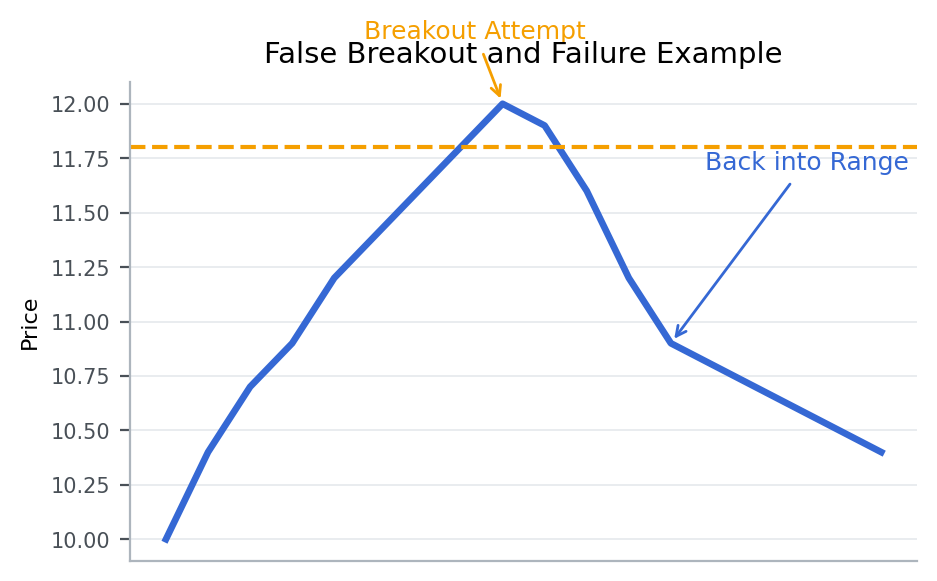
This chart shows price pushing through a level and then falling back into the prior structure. The rejection after the break matters more than the break itself.
Patterns that showed up often in real data
From 2023-01-01 to 2026-03-20, the KRX, South Korea’s main stock exchange, produced the following follow-through after similar setups.
Condition: cases where a 20-day high breakout appeared but follow-through acceptance later split into stronger and weaker outcomes
This table isolates cases that matched 20-day high breakouts whose follow-through quality later diverged.
| Group | 5-day median return | 20-day median return | 5-day positive rate |
|---|---|---|---|
| Overall | -1.2% | -3.1% | 42.9% |
| breakout followed by weak closes | -1.9% | -3.9% | 39.2% |
| breakout followed by strong closes | -1.0% | -2.9% | 43.6% |
5-day median return means the middle result after lining up all 5-day forward returns from cases that matched this setup between 2023-01-01 and 2026-03-20. For example, 5-day median return -1.9% for breakout followed by weak closes means the midpoint of those 5-day forward outcomes landed there. A negative value means the follow-through was weaker more often than not, while a positive value means the stock held up or advanced more often. 20-day median return is read the same way, except it tells you more about whether the move held up over a longer stretch. 5-day positive rate means the share of cases where the stock was actually higher five trading days later.
Overall, this setup did not naturally lead to stronger follow-through. Both the 5-day and 20-day median outcomes were weak, and fewer than half of the cases were higher five sessions later.
The point of the table is not to say the pattern is always good or always bad. It is to show which extra condition changed the follow-through inside the same broad setup.
For breakout followed by weak closes 5-day median return -1.9%, 20-day median return -3.9%, and 5-day positive rate 39.2%. For breakout followed by strong closes 5-day median return -1.0%, 20-day median return -2.9%, and 5-day positive rate 43.6%. In other words, breakout followed by strong closes produced the better follow-through across the metrics shown here.
That is why failed patterns are usually read through weakening closes and lost acceptance, not through the breakout label alone.
Key points from a recent example
A recent example is 라이콤 (388790) on 2026-03-13.
This example was chosen because it matched the article’s core condition: cases where a 20-day high breakout appeared but follow-through acceptance later split into stronger and weaker outcomes. In other words, it is a recent market sample that shows how the concept looked in a real chart.
On the day itself, the stock moved 11.0%, the gap was 2.2%, the closing position was 45.9%, and turnover relative to market cap was 29.1%. On the same day, KOSDAQ, South Korea’s growth-heavy junior market, showed an advance ratio of 48.9%.
Read in the context of the 벤처기업부 sector, the key is not to label the signal too quickly but to judge the close and the follow-through first. The 5-day forward return was -20.9%, and the point of the example is that something that looked like a breakout can turn into a failed pattern quickly when the close cannot hold up.
That is why, when you see a similar setup again, it helps to check how strong the close was and whether the structure held over the next few sessions, not just why the stock moved that day.
Investor checklist
- Watch whether the stock starts losing acceptance above resistance within a few sessions of the breakout.
- If turnover was large but the close still faded, shift the interpretation more cautiously.
- Treat a failed breakout as a revision to the old bullish read, not as proof that every setup was bad.
Common mistakes
The first mistake is judging the move at the moment of the break instead of after the close. Acceptance matters more than excitement.
The second mistake is treating failure as proof of a huge reversal. Sometimes it is only a short-term warning, not a complete change in trend.
The third mistake is ignoring volume and location. A failed move at a major level matters more than one inside random noise.
Summary
False breakouts and failed patterns are about rejection, not just disappointment. They tell you when a move could not hold, when supply or demand pushed back harder than expected, and when the original signal lost credibility.
For more context, read Why Support and Resistance Keep Showing Up on Charts and Breakouts and Pullbacks Need to Be Read Differently.