Introduction
Strong moves do not always look strong in the same way. Some charts show power through a clean breakout. Others show power through the way they pull back after the breakout. If you treat those two phases as identical, you miss a big part of how strong stocks actually behave.
A breakout is about expansion. A pullback is about retention. The first shows whether buyers can push price through resistance. The second shows whether they can defend that progress afterward.
One-line summary for beginners
A breakout becomes more credible when the close stays accepted above resistance and the pullback remains controlled afterward.
Why this signal matters
Reading both phases properly helps you avoid two common mistakes: chasing every breakout and dismissing every pullback as weakness. A stock can break out well and still fail. It can also pull back after a breakout and remain one of the strongest charts in the market.
The quality of the pullback often tells you whether the breakout had real sponsorship behind it. That is why breakouts and pullbacks should be judged with different questions.
When the signal becomes more meaningful
For the breakout, focus on location, volume, and closing strength. Did price clear a level that mattered? Did volume expand? Did the stock close near the highs or immediately give back the move?
For the pullback, focus on depth, speed, and volume behavior. Did price pull back in an orderly way or collapse back through the breakout zone? Did volume dry up, or did sellers become aggressive?
A healthy pullback often respects the breakout level or at least stabilizes above a higher low. A weak one often gives back the entire move and struggles to regain momentum.
Visual guide
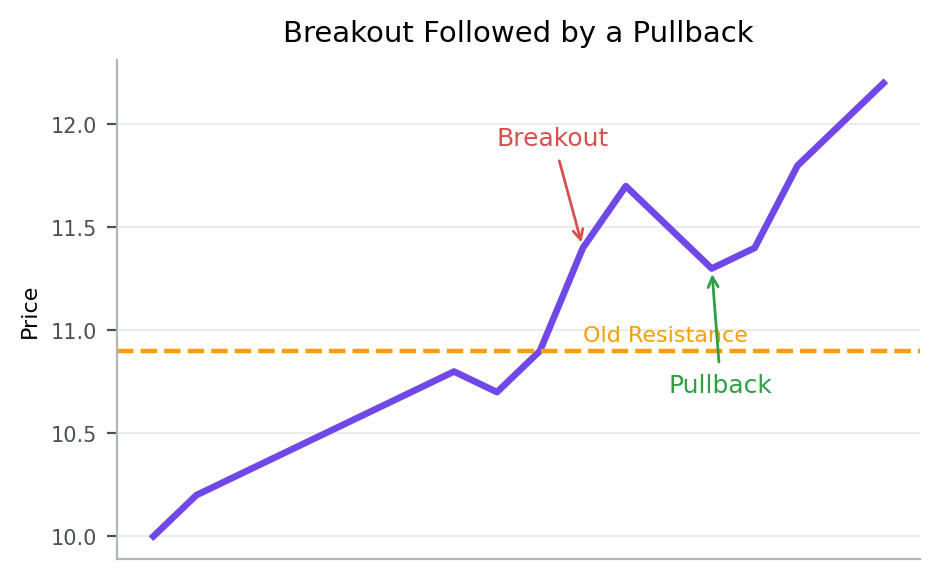
The chart contrasts a breakout that holds its gains with one that loses acceptance quickly. The pullback often reveals more than the breakout candle itself.
Patterns that showed up often in real data
From 2023-01-01 to 2026-03-20, the KRX, South Korea’s main stock exchange, produced the following follow-through after similar setups.
Condition: cases where a 20-day high breakout appeared together with volume at least 2x normal
This table isolates cases that matched breakouts that also came with meaningfully expanded volume.
| Group | 5-day median return | 20-day median return | 5-day positive rate |
|---|---|---|---|
| Overall | -1.2% | -3.1% | 42.9% |
| breakout with strong close acceptance | -1.0% | -2.8% | 44.0% |
| breakout with weak close acceptance | -1.4% | -3.2% | 41.9% |
5-day median return means the middle result after lining up all 5-day forward returns from cases that matched this setup between 2023-01-01 and 2026-03-20. For example, 5-day median return -1.0% for breakout with strong close acceptance means the midpoint of those 5-day forward outcomes landed there. A negative value means the follow-through was weaker more often than not, while a positive value means the stock held up or advanced more often. 20-day median return is read the same way, except it tells you more about whether the move held up over a longer stretch. 5-day positive rate means the share of cases where the stock was actually higher five trading days later.
Overall, this setup did not naturally lead to stronger follow-through. Both the 5-day and 20-day median outcomes were weak, and fewer than half of the cases were higher five sessions later.
The point of the table is not to say the pattern is always good or always bad. It is to show which extra condition changed the follow-through inside the same broad setup.
For breakout with strong close acceptance 5-day median return -1.0%, 20-day median return -2.8%, and 5-day positive rate 44.0%. For breakout with weak close acceptance 5-day median return -1.4%, 20-day median return -3.2%, and 5-day positive rate 41.9%. In other words, breakout with strong close acceptance produced the better follow-through across the metrics shown here.
That is why the breakout day matters less on its own than the way the first pullback behaves afterward.
Key points from a recent example
A recent example is 폴라리스AI (039980) on 2026-03-13.
This example was chosen because it matched the article’s core condition: cases where a 20-day high breakout appeared together with volume at least 2x normal. In other words, it is a recent market sample that shows how the concept looked in a real chart.
On the day itself, the stock moved 16.5%, the gap was 8.0%, the closing position was 64.0%, and turnover relative to market cap was 138.9%. On the same day, KOSDAQ, South Korea’s growth-heavy junior market, showed an advance ratio of 48.9%.
Read in the context of the 중견기업부 sector, the key is not to label the signal too quickly but to judge the close and the follow-through first. The 5-day forward return was -8.5%, and the point of the example is that the first pullback and support behavior often matter more than the breakout candle itself.
That is why, when you see a similar setup again, it helps to check how strong the close was and whether the structure held over the next few sessions, not just why the stock moved that day.
Investor checklist
- On the breakout day, first confirm that the stock actually closed above the breakout level.
- During the pullback, look for lighter turnover and support that still holds.
- If price slips back quickly, keep the failed-breakout scenario open instead of assuming strength.
Common mistakes
The first mistake is assuming every breakout deserves trust. Breakouts need acceptance, not just a brief push above resistance.
The second mistake is treating every pullback as failure. Pullbacks are part of trend behavior when they remain controlled.
The third mistake is ignoring volume after the breakout. The pullback phase often tells you whether participation is leaving or simply resting.
Summary
Breakouts prove that buyers can clear a level. Pullbacks prove whether they can defend it. You need both pieces to understand the quality of a move.
For the next layer, read What Strong Stocks Tend to Look Like on a Chart and How to Read Failed Patterns and False Breakouts.