Introduction
Moving averages are everywhere because they make price easier to read. Instead of staring at every daily fluctuation, you get a smoother view of where price sits relative to its recent average. That alone can tell you whether a move is orderly, stretched, improving, or losing momentum.
You do not need the formula to use them well. What matters is the relationship between price and the average, the slope of the average itself, and how price reacts when it pulls back toward it.
One-line summary for beginners
Moving averages do not predict the future; they help organize where price sits inside a short-term and medium-term trend.
Why this signal matters
Moving averages give context to price. A stock above a rising 20-day average usually behaves differently from a stock below a falling 60-day average, even if both are green on the day.
They also help describe a chart clearly. When price is holding above the 20-day line, reclaiming a short-term average, or failing under a longer average, you are not just naming indicators. You are describing where control sits in the current trend.
When the signal becomes more meaningful
The simplest read is whether price is above or below the average. Above a rising average usually supports a stronger reading. Below a falling average usually supports a weaker one.
The next step is time horizon. A 5-day average reflects short-term speed. A 20-day average is often a useful guide for the near-term trend. A 60-day average gives a broader sense of intermediate structure. None of them is magical, but each offers a different layer of context.
You also want to watch interaction, not just location. A pullback into a rising 20-day average that quickly stabilizes is different from a stock that breaks below it and cannot recover. The response at the line matters more than the line itself.
Visual guide
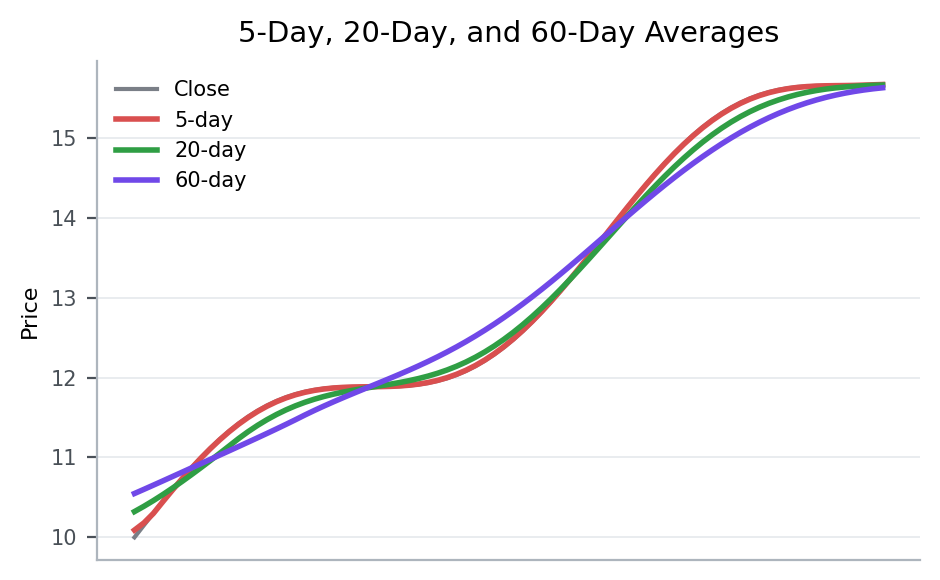
In this example, the short average reacts fastest, the 20-day average helps frame the trend, and the longer average shows the broader direction. Their order and slope tell you as much as the current candle does.
Patterns that showed up often in real data
From 2023-01-01 to 2026-03-20, the KRX, South Korea’s main stock exchange, produced the following follow-through after similar setups.
Condition: cases where the 5-day average > 20-day average > 60-day average alignment was visible
This table isolates cases that matched cases where the 5-day, 20-day, and 60-day averages lined up in a bullish order.
| Group | 5-day median return | 20-day median return | 5-day positive rate |
|---|---|---|---|
| Overall | -0.5% | -1.5% | 43.6% |
| distance from the 20-day average stayed reasonable | -0.2% | -0.7% | 44.1% |
| price was already stretched far from the 20-day average | -1.0% | -2.8% | 43.3% |
5-day median return means the middle result after lining up all 5-day forward returns from cases that matched this setup between 2023-01-01 and 2026-03-20. For example, 5-day median return -0.2% for distance from the 20-day average stayed reasonable means the midpoint of those 5-day forward outcomes landed there. A negative value means the follow-through was weaker more often than not, while a positive value means the stock held up or advanced more often. 20-day median return is read the same way, except it tells you more about whether the move held up over a longer stretch. 5-day positive rate means the share of cases where the stock was actually higher five trading days later.
Overall, this setup did not naturally lead to stronger follow-through. Both the 5-day and 20-day median outcomes were weak, and fewer than half of the cases were higher five sessions later.
The point of the table is not to say the pattern is always good or always bad. It is to show which extra condition changed the follow-through inside the same broad setup.
For distance from the 20-day average stayed reasonable 5-day median return -0.2%, 20-day median return -0.7%, and 5-day positive rate 44.1%. For price was already stretched far from the 20-day average 5-day median return -1.0%, 20-day median return -2.8%, and 5-day positive rate 43.3%. In other words, distance from the 20-day average stayed reasonable produced the better follow-through across the metrics shown here.
That is why even a bullish moving-average alignment should be checked against stretch from the averages, not treated as automatic strength.
Key points from a recent example
A recent example is 이루온 (065440) on 2026-03-13.
This example was chosen because it matched the article’s core condition: cases where the 5-day average > 20-day average > 60-day average alignment was visible. In other words, it is a recent market sample that shows how the concept looked in a real chart.
On the day itself, the stock moved 0.5%, the gap was 1.6%, the closing position was 27.6%, and turnover relative to market cap was 97.0%. On the same day, KOSDAQ, South Korea’s growth-heavy junior market, showed an advance ratio of 48.9%.
Read in the context of the 벤처기업부 sector, the key is not to label the signal too quickly but to judge the close and the follow-through first. The 5-day forward return was 0.2%, and the point of the example is that a clean bullish alignment can still be overheated if price has already stretched too far from the averages.
That is why, when you see a similar setup again, it helps to check how strong the close was and whether the structure held over the next few sessions, not just why the stock moved that day.
Investor checklist
- Look first at the order of the moving averages, not only whether price is above them.
- If price is stretched too far above the 20-day average, include overheating risk in the read.
- Do not overtrust short-term strength when the stock is still under a more important medium-term average.
Common mistakes
The first mistake is treating every moving average the same way. A short-term average and a longer-term average do not measure the same thing.
The second mistake is assuming price above an average always means strength. If price is far too extended, it may actually be telling you the move is vulnerable to cooling off.
The third mistake is relying on crossovers without checking price structure and volume. By the time the averages cross, the important move may already be well underway.
Summary
Moving averages are best used as context tools. They help you judge trend direction, support and resistance behavior, and whether a move is orderly or overextended.
For related concepts, read The Easiest Way to Tell an Uptrend, Downtrend, and Range Apart and Overbought and Oversold Are Warnings, Not Automatic Reversal Signals.