Introduction
A stock rarely moves in isolation. Sector rotation, theme momentum, and group leadership often shape how individual charts behave. If you only read the stock and ignore the group around it, you can miss whether the move is being driven by genuine leadership or by background money flow.
That is where relative strength comes in. It helps you compare the stock not just against its own past, but against the market and against the names moving with it.
One-line summary for beginners
To judge whether a stock is truly strong, first ask whether it is also outperforming its sector and the wider market.
Why this signal matters
Relative strength tells you whether the stock is simply participating or actually leading. A stock that holds up better than the index, recovers faster than peers, or breaks out before the rest of the theme often deserves more respect.
It also helps explain why some good-looking charts stall. If the broader theme is weak, even a decent individual chart may struggle to sustain momentum.
When the signal becomes more meaningful
Start by comparing the stock to the broader market. If the index is weak but the stock remains firm, that is often a useful sign of relative strength. If the index is strong and the stock cannot participate, that is a warning.
Then compare the stock to names in the same sector or theme. Which one broke out first? Which one is holding gains better? Which one is recovering faster after pullbacks?
Group behavior matters too. A move driven by several related names often has more depth than a move driven by one isolated spike. Relative strength becomes more convincing when it is visible in a broader cluster.
Visual guide
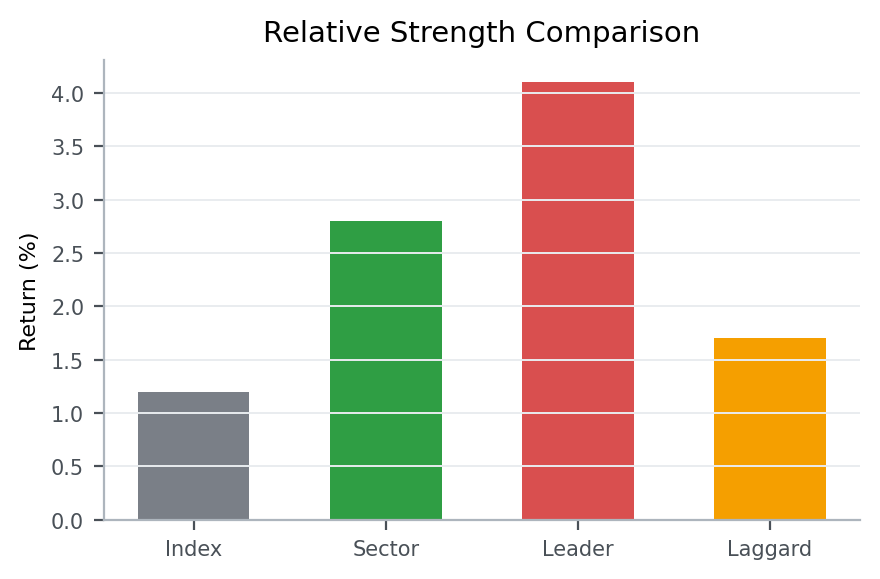
The bars compare the broader market, the sector, a leader, and a laggard. The goal is to see whether the stock is outperforming the context around it or simply moving with the tide.
Patterns that showed up often in real data
From 2023-01-01 to 2026-03-20, the KRX, South Korea’s main stock exchange, produced the following follow-through after similar setups.
Condition: cases where both the stock and its sector were outperforming the market
This article looks at what happened in the market after cases that matched cases where both the stock and the sector were outperforming the market.
5-day median return means the middle result after lining up all 5-day forward returns from cases that matched this setup between 2023-01-01 and 2026-03-20. For example, 5-day median return -0.9% for overall sample means the midpoint of those 5-day forward outcomes landed there. A negative value means the follow-through was weaker more often than not, while a positive value means the stock held up or advanced more often. 5-day positive rate means the share of cases where the stock was actually higher five trading days later.
Across the full sample 5-day median return -0.9%, and 5-day positive rate 42.8%.
Overall, this setup did not naturally lead to stronger follow-through. Both the 5-day and 20-day median outcomes were weak, and fewer than half of the cases were higher five sessions later.
That is why stock strength is easier to trust when the sector is also participating rather than leaving the move isolated.
Key points from a recent example
A recent example is 폴라리스AI (039980) on 2026-03-13.
This example was chosen because it matched the article’s core condition: cases where both the stock and its sector were outperforming the market. In other words, it is a recent market sample that shows how the concept looked in a real chart.
On the day itself, the stock moved 16.5%, the gap was 8.0%, the closing position was 64.0%, and turnover relative to market cap was 138.9%. On the same day, KOSDAQ, South Korea’s growth-heavy junior market, showed an advance ratio of 48.9%.
Read in the context of the 중견기업부 sector, the key is not to label the signal too quickly but to judge the close and the follow-through first. The 5-day forward return was -8.5%, and the point of the example is that you should separate stock-only strength from strength that is reinforced by the sector backdrop.
That is why, when you see a similar setup again, it helps to check how strong the close was and whether the structure held over the next few sessions, not just why the stock moved that day.
Investor checklist
- Even on a strong day, first check whether the whole sector is also acting well.
- Separate market-relative strength from sector-relative strength.
- Inside a strong sector, distinguish the true leaders from the lagging followers.
Common mistakes
The first mistake is giving all the credit to the stock when the whole group is carrying it. Group context matters.
The second mistake is assuming every stock in a hot theme has the same quality. Leaders and laggards often look very different on the chart.
The third mistake is confusing relative strength with safety. Outperformance tells you who is stronger, not that risk has disappeared.
Summary
Sector and theme relative strength help you see whether a stock is actually leading, merely participating, or quietly lagging. That perspective adds depth to any chart read because no stock trades inside a vacuum.
To expand this lens, read How to Read Foreign and Institutional Flow Differently and How News and Events Actually Show Up on a Chart.