Introduction
Trend tells you direction. Volume tells you participation. When the two line up, chart signals often become more credible. When they diverge, the same price move can look much less trustworthy.
That is why trend and volume should be read together. Price can move without broad support. Volume can surge without improving the chart. The best signals usually appear when both are working in the same direction.
One-line summary for beginners
Trend and volume together help separate healthy strength from a move that is already starting to tire.
Why this signal matters
This combination helps you judge whether a move is being confirmed or merely advertised. A breakout with strong volume inside an improving trend usually deserves more respect than an identical percentage move in a weak or unstable chart.
It also helps you read pullbacks better. A trend that pauses on fading volume often looks healthy. A trend that pulls back under heavy selling pressure may be telling a different story.
When the signal becomes more meaningful
Start by identifying the trend. Is the stock already trending higher, trying to reverse, or still weak? Volume only becomes meaningful after you know what kind of structure it is interacting with.
Then compare volume with the phase of the move. Rising volume on a breakout, reclaim, or higher-high attempt often supports the move. Falling volume on a pullback inside an uptrend often helps keep the chart constructive.
If the opposite happens, pay attention. Heavy volume on a weak close, or repeated volume spikes without net progress, can suggest the trend is less healthy than it appears.
Visual guide
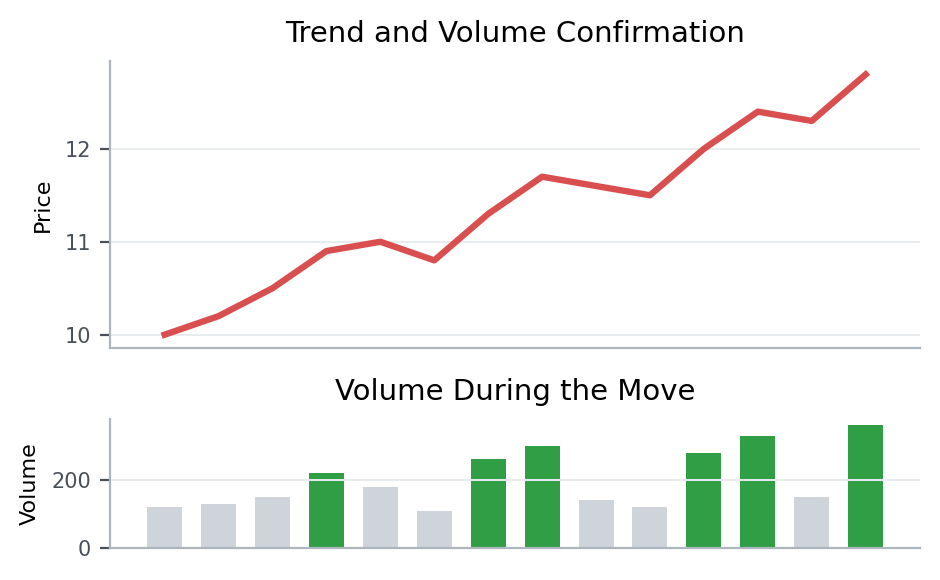
This example contrasts a move supported by participation with one that looks active but less convincing once volume behavior is considered.
Patterns that showed up often in real data
From 2023-01-01 to 2026-03-20, the KRX, South Korea’s main stock exchange, produced the following follow-through after similar setups.
Condition: cases where trend improvement and volume at least 2x normal appeared together
This table isolates cases that matched setups where trend improvement and volume confirmation appeared together.
| Group | 5-day median return | 20-day median return | 5-day positive rate |
|---|---|---|---|
| Overall | -0.9% | -2.7% | 43.9% |
| volume confirmation with a strong close | -0.8% | -2.4% | 44.9% |
| volume expanded but the close stayed weak | -1.1% | -2.9% | 43.0% |
5-day median return means the middle result after lining up all 5-day forward returns from cases that matched this setup between 2023-01-01 and 2026-03-20. For example, 5-day median return -0.8% for volume confirmation with a strong close means the midpoint of those 5-day forward outcomes landed there. A negative value means the follow-through was weaker more often than not, while a positive value means the stock held up or advanced more often. 20-day median return is read the same way, except it tells you more about whether the move held up over a longer stretch. 5-day positive rate means the share of cases where the stock was actually higher five trading days later.
Overall, this setup did not naturally lead to stronger follow-through. Both the 5-day and 20-day median outcomes were weak, and fewer than half of the cases were higher five sessions later.
The point of the table is not to say the pattern is always good or always bad. It is to show which extra condition changed the follow-through inside the same broad setup.
For volume confirmation with a strong close 5-day median return -0.8%, 20-day median return -2.4%, and 5-day positive rate 44.9%. For volume expanded but the close stayed weak 5-day median return -1.1%, 20-day median return -2.9%, and 5-day positive rate 43.0%. In other words, volume confirmation with a strong close produced the better follow-through across the metrics shown here.
That is why the quality of the close and the quieter pullback afterward often matter more than the headline volume spike itself.
Key points from a recent example
A recent example is 폴라리스AI파마 (041910) on 2026-03-13.
This example was chosen because it matched the article’s core condition: cases where trend improvement and volume at least 2x normal appeared together. In other words, it is a recent market sample that shows how the concept looked in a real chart.
On the day itself, the stock moved 30.0%, the gap was -1.6%, the closing position was 100.0%, and turnover relative to market cap was 78.4%. On the same day, KOSDAQ, South Korea’s growth-heavy junior market, showed an advance ratio of 48.9%.
Read in the context of the 중견기업부 sector, the key is not to label the signal too quickly but to judge the close and the follow-through first. The 5-day forward return was -5.4%, and the point of the example is that a loud volume day only becomes a better signal when later support behavior confirms it.
That is why, when you see a similar setup again, it helps to check how strong the close was and whether the structure held over the next few sessions, not just why the stock moved that day.
Investor checklist
- In healthy strength, turnover often expands on advances and cools during pullbacks.
- The quieter pullback after the breakout can matter more than the breakout day itself.
- Late explosive turnover can also be a sign of crowded chasing, so keep that risk in mind.
Common mistakes
The first mistake is assuming high volume always confirms the move. It only confirms the move if price also behaves well.
The second mistake is ignoring volume during the pullback. That phase often says a lot about whether the trend is being defended.
The third mistake is forgetting that volume must be judged relative to the stock’s normal behavior, not in isolation.
Summary
Trend and volume together tell you more than either one can alone. Trend frames the move, volume tests the conviction behind it, and the interaction between them often reveals signal quality.
For related reading, go to Why Volume Often Matters Before Price and What Strong Stocks Tend to Look Like on a Chart.