Introduction
Technical indicators can be helpful, but they become dangerous when people expect them to replace price action. RSI, MACD, and Bollinger Bands are not decision machines. They are context tools that can sharpen a read when the chart already has structure.
That is the right mindset for all three. Use them to support a chart read, not to overpower it.
One-line summary for beginners
Indicators work best as secondary checks on heat and momentum, not as stand-alone direction calls.
Why this signal matters
Indicators are useful when they answer a specific question. Is the move getting stretched? Is momentum improving or fading? Is volatility expanding? Those are the kinds of questions RSI, MACD, and Bollinger Bands can help with.
They become less useful when they are treated as stand-alone signals. A stock is not bullish just because MACD crossed, and it is not automatically bearish just because RSI is high.
When the signal becomes more meaningful
RSI is best thought of as a speed gauge. It helps identify when price has become unusually extended in one direction. That matters, but extension is not the same thing as reversal.
MACD is better for momentum direction than for exact timing. It can help show when trend acceleration is improving or fading, but it usually reacts after price has already started moving.
Bollinger Bands are most useful for understanding volatility and expansion. A squeeze can tell you the stock has become compressed. A band expansion can tell you the move has become more active. Neither one tells you everything about direction on its own.
Visual guide
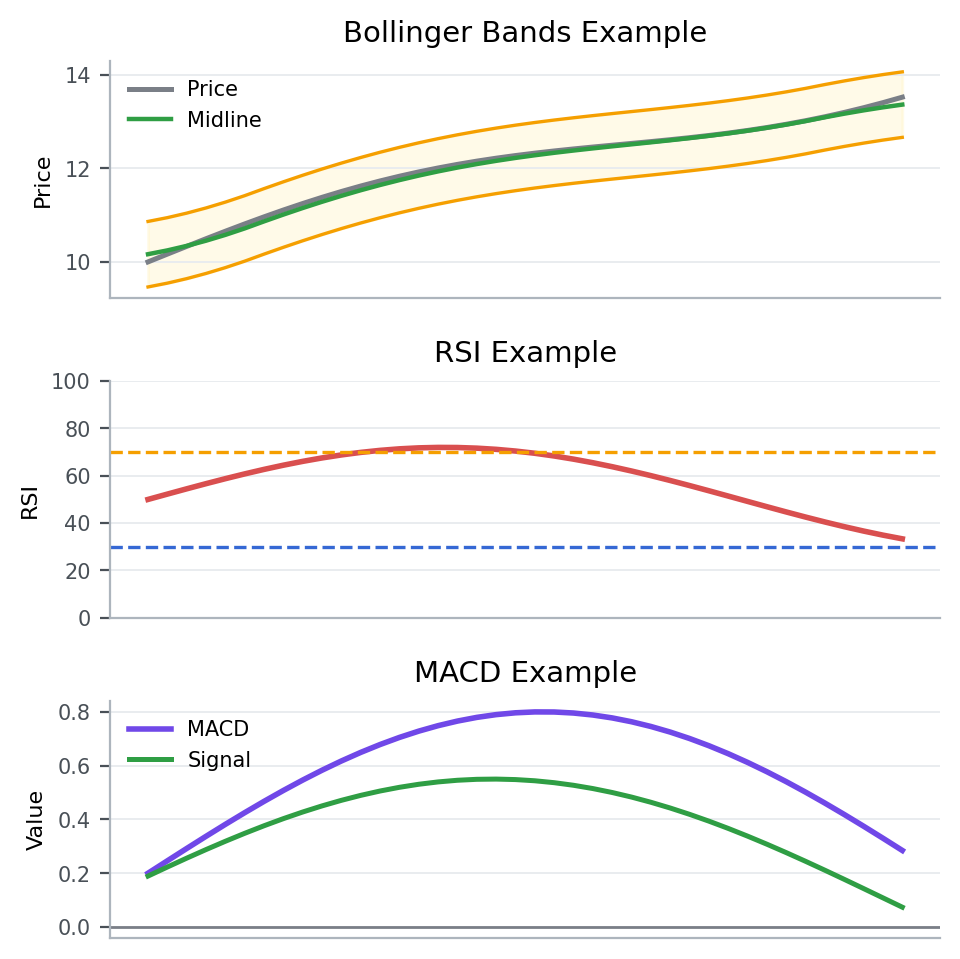
The chart shows how each indicator frames a different part of the same move: speed, momentum, and volatility. Their value comes from context, not from isolated readings.
Patterns that showed up often in real data
From 2023-01-01 to 2026-03-20, the KRX, South Korea’s main stock exchange, produced the following follow-through after similar setups.
Condition: cases where RSI(14) was at least 70 and price structure had not broken down yet
This article looks at what happened in the market after cases that matched overbought RSI readings where price structure still held up.
5-day median return means the middle result after lining up all 5-day forward returns from cases that matched this setup between 2023-01-01 and 2026-03-20. For example, 5-day median return -0.5% for overall sample means the midpoint of those 5-day forward outcomes landed there. A negative value means the follow-through was weaker more often than not, while a positive value means the stock held up or advanced more often. 20-day median return is read the same way, except it tells you more about whether the move held up over a longer stretch.
Across the full sample 5-day median return -0.5%, and 20-day median return -1.2%.
Overall, this setup did not naturally lead to stronger follow-through. Both the 5-day and 20-day median outcomes were weak, and fewer than half of the cases were higher five sessions later.
For overbought indicator with a strong close 5-day median return -0.5%, and 20-day median return -1.1%. For overbought indicator with a weak close 5-day median return -0.5%, and 20-day median return -1.2%. If the gap stays small, this condition alone is not enough to separate stronger from weaker outcomes.
That is why high RSI readings should be read alongside price structure and the close, not treated as stand-alone reversal signals.
Key points from a recent example
A recent example is 에이비프로바이오 (195990) on 2026-03-13.
This example was chosen because it matched the article’s core condition: cases where RSI(14) was at least 70 and price structure had not broken down yet. In other words, it is a recent market sample that shows how the concept looked in a real chart.
On the day itself, the stock moved 30.0%, the gap was -1.8%, the closing position was 100.0%, and turnover relative to market cap was 11.5%. On the same day, KOSDAQ, South Korea’s growth-heavy junior market, showed an advance ratio of 48.9%.
Read in the context of the 투자주의환기종목(소속부없음) sector, the key is not to label the signal too quickly but to judge the close and the follow-through first. The 5-day forward return was 41.3%, and the point of the example is that a high indicator reading still needs to be checked against price structure and the close before you lean on it.
That is why, when you see a similar setup again, it helps to check how strong the close was and whether the structure held over the next few sessions, not just why the stock moved that day.
Investor checklist
- Read price structure and turnover before reading RSI or MACD.
- Treat overbought readings as warnings, not automatic sell signals.
- When the indicator and price disagree, give more weight to the close and follow-through.
Common mistakes
The first mistake is treating high RSI as an automatic sell signal. Strong stocks can stay overbought for longer than most traders expect.
The second mistake is expecting MACD to lead every trend change. It often confirms after price has already moved.
The third mistake is treating a Bollinger Band touch as a forecast. Price can walk the band in a strong trend without reversing.
Summary
RSI, MACD, and Bollinger Bands can improve a chart read when they are used for the right job. RSI helps with extension, MACD helps with momentum direction, and Bollinger Bands help with volatility and expansion.
For a broader view of context, read Overbought and Oversold Are Warnings, Not Automatic Reversal Signals and Trend and Volume Together Change the Quality of a Signal.